【绝对经典,交易必备】史上最全30种指标顶底背离指示器-EA分享网(eafxw.com)会员版
【参数设置】Osc参数选择对应编号切换不同指标类型,多达数十种可自定义参数设置,小白、专家皆可使用。
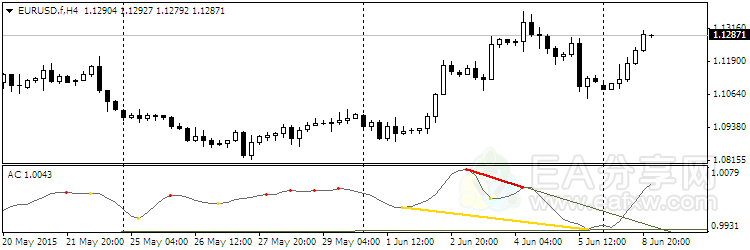
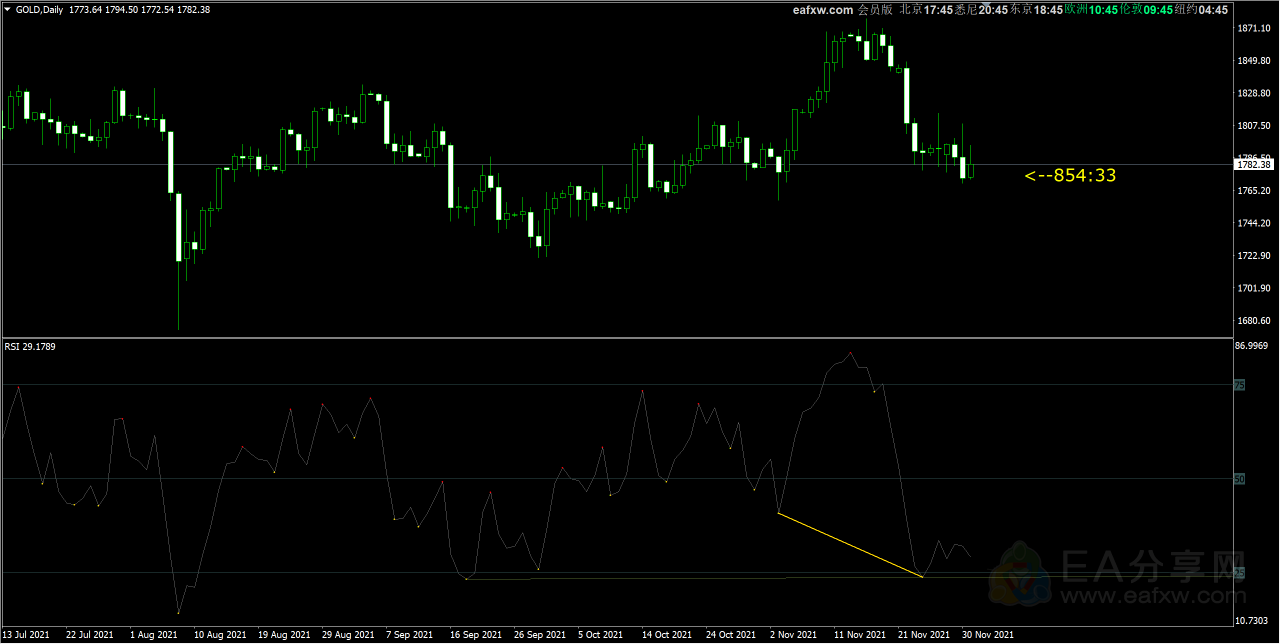
【功能介绍】基于30种技术指标,自动识别顶底、背离,并用不同颜色标识出来,其他众多功能自行研究。


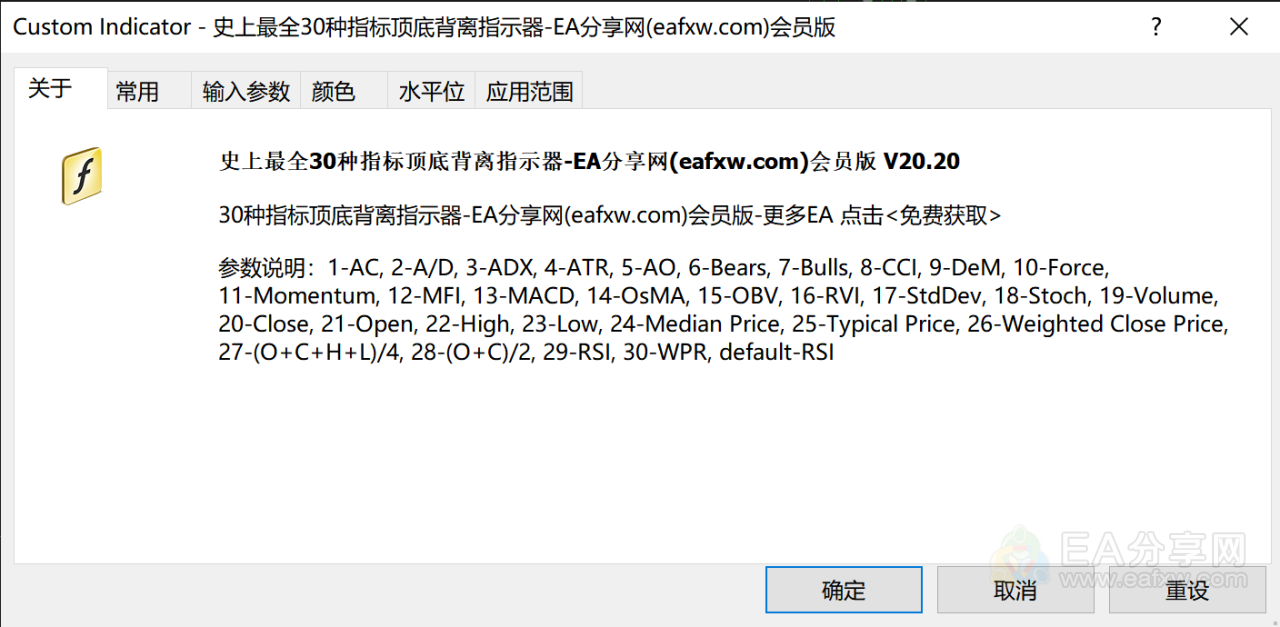
指标目录及对应编号(想用什么指标就在Osc参数设置对应编号):
- Accelerator
- Accumulation/Distribution
- Average Directional Movement Index
- Average True Range
- Awesome oscillator
- Bears Power
- Bulls Power
- Commodity Channel Index
- DeMarker
- Force Index
- Momentum
- Money Flow Index
- Moving Averages Convergence/Divergence
- Moving Average of Oscillator
- On Balance Volume
- Relative Vigor Index
- Standard Deviation
- Stochastic Oscillator
- Volume
- Close
- Open
- High
- Low
- (H+L)/2
- (H+L+C)/3
- (H+L+C+C)/4
- (O+C+H+L)/4
- (O+C)/2
- Relative Strength Index
- Larry Williams’ Percent Range
- Relative Strength Index
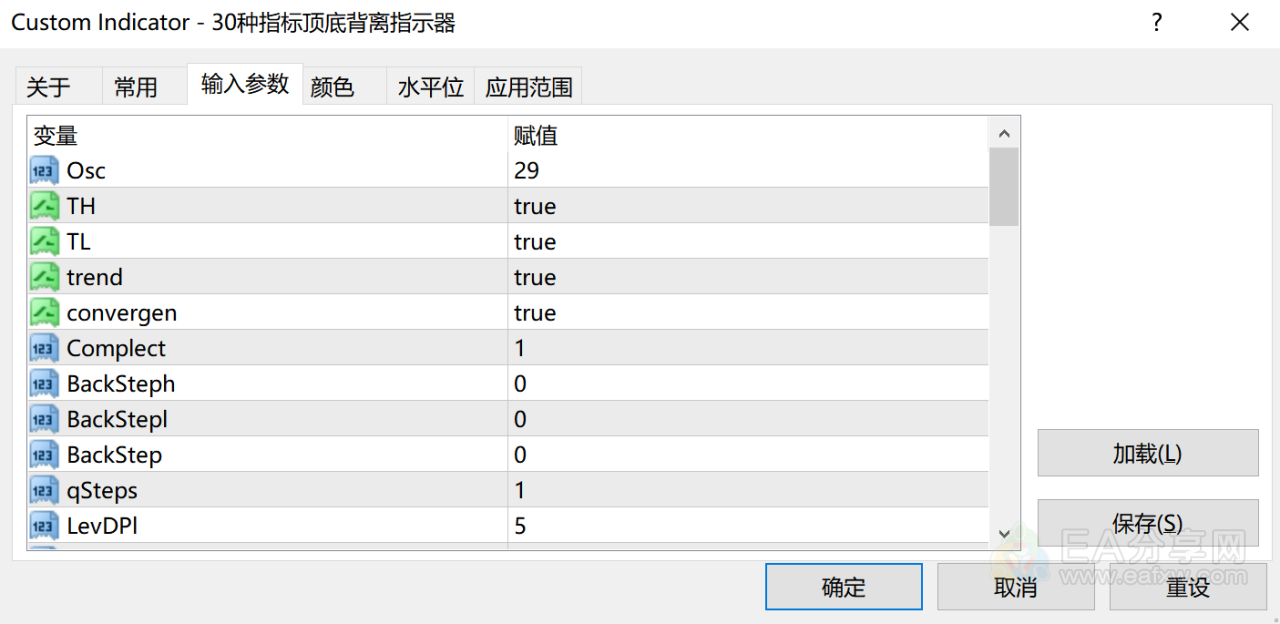
参数设置:
- Osc=29 — 指标编号;
- TH=true — 看跌背离;
- TL=true — 看涨背离;
- trend=true — 支撑/阻力线;
- convergen=true — 隐藏的背离;
- Complect=1 — 图表上指标的识别指数;
- BackSteph=0 — 回退的步数 高点;
- BackStepl=0 — 回退步数 低点;
- BackStep=0 — 回退的步数;
- qSteps=1 — 显示的步数,不超过三个;
- LevDPl=5 — DeMark水平点(2=中心线位于左侧两条线的上方(下方));
- LevDPr=1 — DeMark水平点(2=中心线位于右侧两条线的上方(下方));
- period=8 — iADX, iATR, iBearsPower, iBullsPower, iCCI, iDeMarker, iForce, iMomentum, iMFI, iRVI, iStdDev, iRSI, iRSI, iWPR的周期;
- ma_method=0 — iStochastic、iStdDev、iForce 的平均方法;
- ma_shift=0 — iStdDev 的 MA 偏移;
- Applied_price=4 — iRSI、iRSI、iStdDev、iOBV、iOsMA、iMACD、iMomentum、iForce、iCCIiBullsPower、iBearsPower、iADX 的应用价格;
- mode=0 — iStochastic、iRVI、iMACD、iADX 的线索引;
- fast_ema_period=12 — iOsMA、iMACD 的快速 MA 周期;
- slow_ema_period=26 — iOsMA、iMACD 的慢速 MA 周期;
- signal_period=9 — iOsMA、iMACD 的信号线周期;
- Kperiod=13 — iStochastic 的 K 线周期;
- Dperiod=5 — iStochastic 的 D 线周期;
- slowing=3 — iStochastic 的减速;
- price_field=0 — iStochastic 的应用价格;
- showBars=1000 — 如果 = 0,则为显示整个图表的指标;
- Trend_Down=true — 阻力线;
- Trend_Up=true — 支撑线;
- TrendLine=true — 支撑/阻力线;
- HandyColour=true;
- Highline=Red — HL 通道颜色;
- Lowline=DeepSkyBlue — LL 通道颜色;;
- ChannelLine=false — 平行于趋势线的通道;
- Trend=0 — 1 :仅适用于 UpTrendLines,-1 :仅适用于 DownTrendLines,0 :适用于所有 TrendLine;
- Channel=false — 通道;
- Regression=true — true:线性回归通道,false :标准偏差通道;
- RayH=true — 高通道的射线;
- RayL=true — 低通道的射线;
- ChannelH=Red — 高通道的颜色;
- ChannelL=DeepSkyBlue — 低通道的颜色;
- STD_widthH=1.0 — 高通道对象的偏差大小;
- STD_widthL=1.0 — 低通道对象的偏差大小;
- comment=false — 显示备注;
- code=159 — Wingdings字体的字符代码,用于显示极值;
- BuyStop=false — 买入止损水平;
- SellLimit=false — 卖出限价水平;
- SellStop=false — 卖出止损水平;
- BuyLimit=false — 买入限价水平。
建议:
- 指标的颜色和极值点可以在颜色选项卡中配置。
- 将多个指标附加到图表时,更改 Complect 参数。


没有回复内容